Jack, a member of the sustainability team at a construction company in the United States, is hard at work trying to find specific emissions factors pertaining to his organization’s grid electricity consumption. Why does he need these emissions factors? They are an essential building block required to calculate the organization's Scope 2 emissions, as part of their total greenhouse gas emissions report.
There’s one of two ways Jack can find these values:
- Use state-level emissions factors for the state where the organization is located
- Use emissions factors determined by eGRID subregions
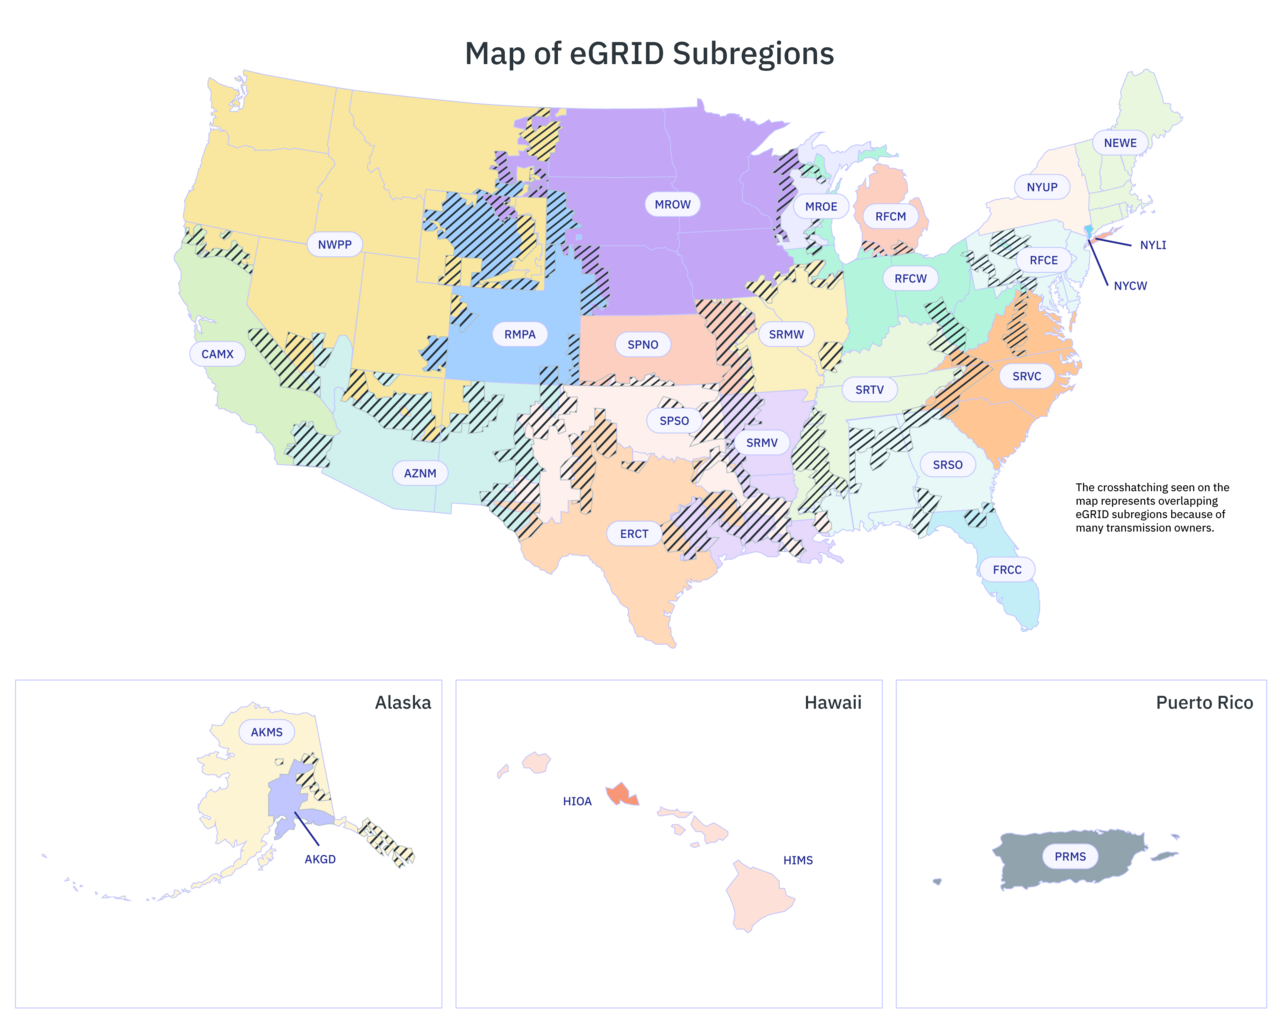
What’s an eGRID subregion? This is mapped out according to the transmission and utility service territories of power plants, which don’t follow official state boundaries. There are a total of 26 eGRID subregions in the United States which all have unique emissions factors pertaining to grid electricity consumption.
As a member of the sustainability team, Jack knows it’s better to use emissions factors pertaining to eGRID subregions rather than state-level emissions, which aren’t always as precise.
Follow Jack as he explores the two different ways to find his organization's eGRID subregion, to get a more accurate value when calculating the organization’s total electricity consumption emissions.
How to locate your organization's eGRID subregion
An eGRID map, which outlines the various subregions in the United States, can be found online.
The following image is a recreation which showcases the 2021 eGRID subregion map, according to the US Environmental Protection Agency (EPA):

These maps are just approximations, which is why the EPA offers two tools organizations can use to find their exact eGRID subregion according to various site locations.
1. Online Power Profiler Tool
The first tool is known as the Power Profiler, according to the EPA’s website. This can help you find your eGRID subregion by zip code. All you have to do is enter the zip code of your organization’s location and select your utility provider. How do you know who your utility provider is? Simply look at previous utility bills or ask your building manager. Piece of cake!
This tool also presents you with other data pertaining to your specific eGRID subregion which include the fuel mix that is used to generate electricity in your region compared to the national fuel mix, as well as the average emission rates in your subregion versus those across the country.
2. Excel Power Profiler Tool
If you only have a few facilities located in the United States, then use the above method. If you have several facilities located all over the country, it may be best to use the second tool offered by the EPA. This tool is called the Power Profiler eGRID Subregion and GHG Emissions Finder Tool.
Simply download the Excel spreadsheet found on the Power Profiler page, mentioned in the first method, and take the time to read the introductions tab. Once you have finished reading, you can move to the Data Entry tab in Column B, where you can enter in multiple zip codes. Once you have completed that, eGRID subregions will appear in Column D, as well as eGRID subregion total output emissions rates in lb/MWh for select greenhouse gases.
This method is much simpler for organizations who have sites across the United States, allowing key stakeholders like Jack, to get a clearer picture of the eGRID subregions by zip code and total emissions rates.
What's next?
Now that you have the right subregions pertaining to your facilities, record the emissions factors associated with these subregions listed by the EPA. With these values, you can now calculate your organization's total grid electricity emissions. But that’s just one piece of the puzzle.
Read our blog, Electricity Emissions Factors and How to Calculate Your Electricity Emissions, to find out how to calculate your organization's total electricity emissions needed when conducting GHG accounting.
